
Stop Living In Spreadsheets
Start Leading with Insight.
Transform raw lease data into a comprehensive view of your portfolio’s performance.
How It Works Request Demo
A New Era of Portfolio Insight
Prophia Portfolio doesn’t just give you visibility—it gives you confidence in the data. With verified insights coming directly from your contracts, you get a level of clarity that manual input systems simply can’t match.
What if Your Data Could Tell a Story?
Not just numbers on a page, but a clear, compelling narrative about where your portfolio stands today—and where it’s headed tomorrow.

A dashboard that feels like a command center, giving you a real-time pulse on your portfolio.

Reports that don’t just show numbers but reveal opportunities, risks, and trends.

Historical data that doesn’t just look backward but helps you predict what’s next.

At its foundation, Prophia brings value with efficiency and risk management within your portfolio. The secondary layer is what you do with that data to define and differentiate yourself as an organization.
– Managing Director, Spear Street Capital
The Big Picture, Made Simple
-
Gain Deeper Insights
Deep Dive into the Details
Explore verified, granular data across your entire portfolio, tracking key metrics like occupancy rates, lease expirations, and rent growth to uncover hidden opportunities and trends that drive informed decision-making.
See the Big Picture
Interactive dashboards offer a bird’s-eye view of your portfolio’s performance, visualizing portfolio-wide metrics such as rent growth, tenant health, and lease expirations to empower strategic decisions.
Customizable Metrics for Deeper Insights
Group and break down your portfolio data by categories like geography, asset type, or tenant class to eliminate the noise and deliver clear, actionable insights across your entire portfolio.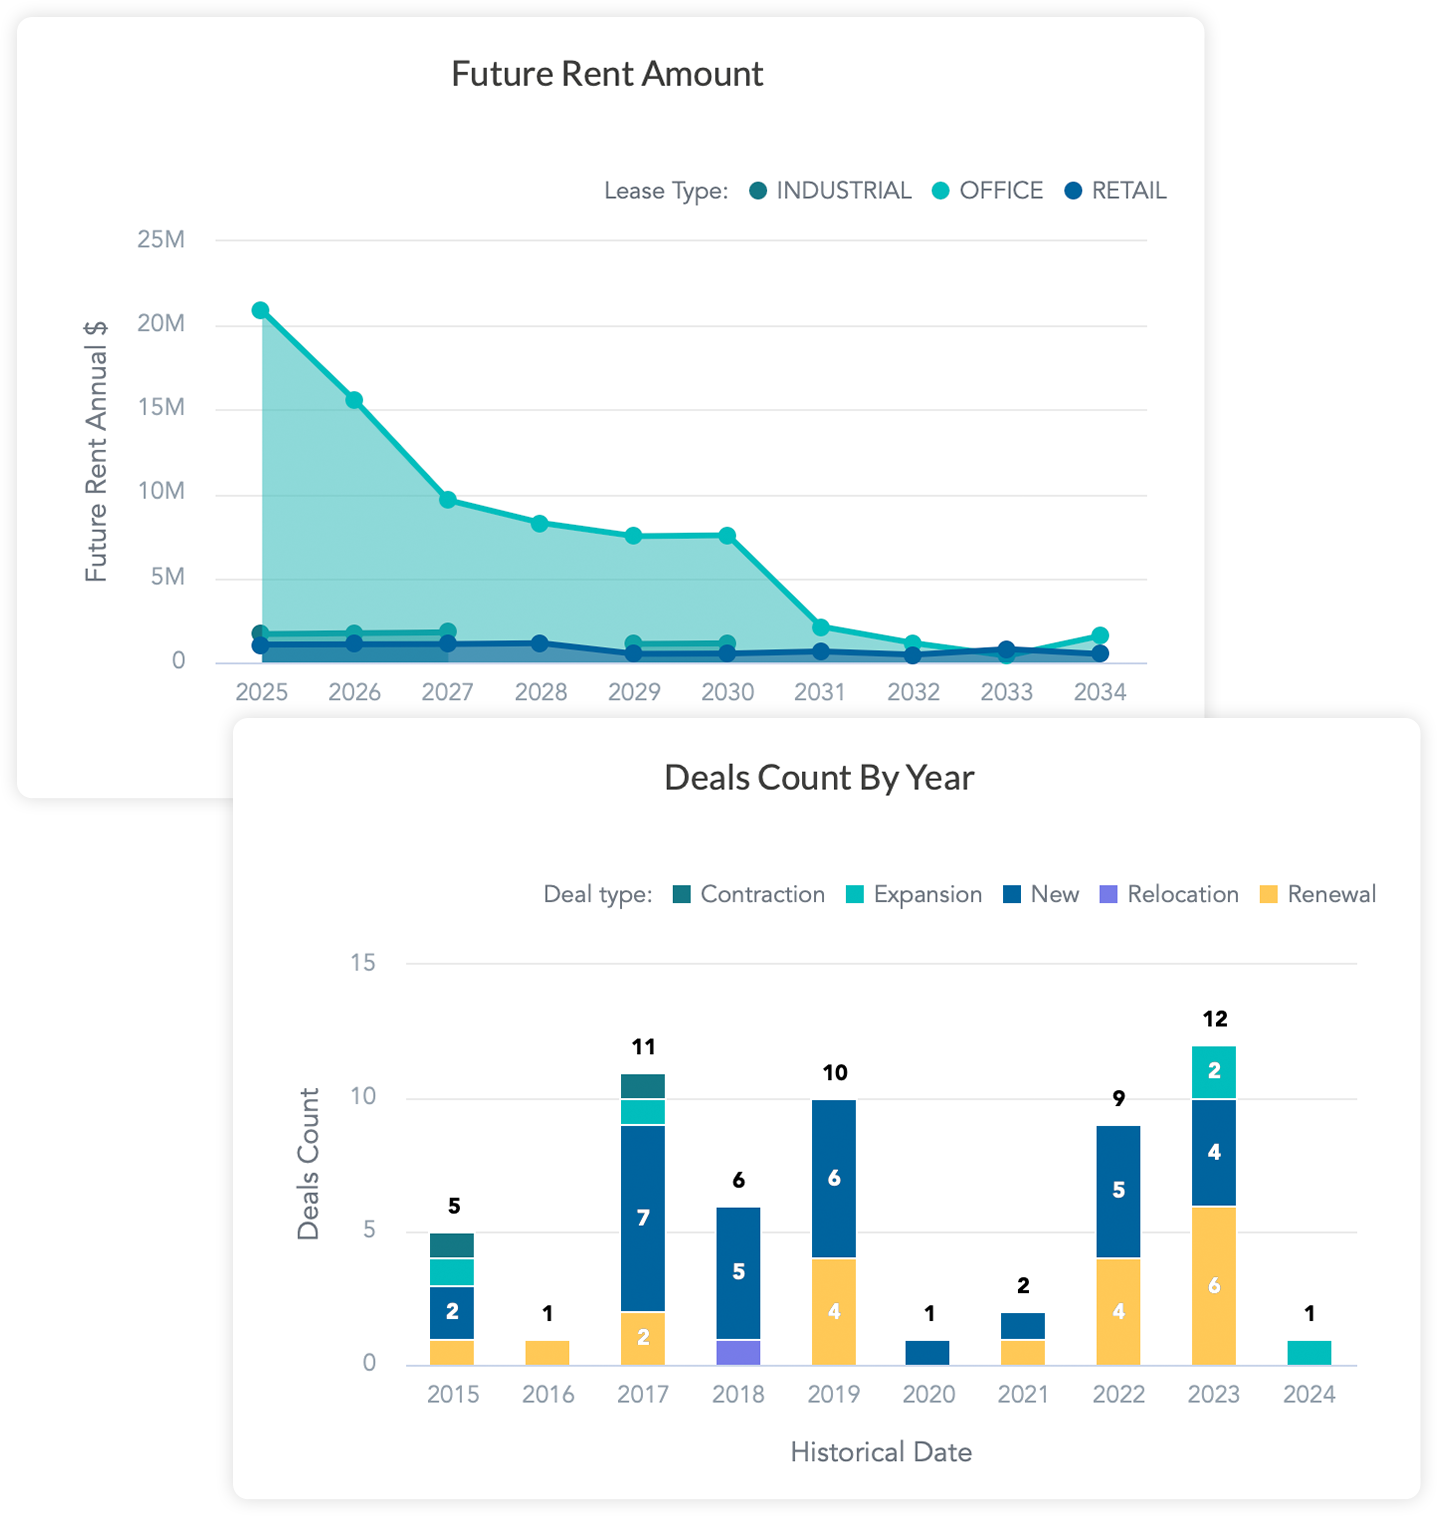
-
Drive Strategic Action
Proactive Lease Management
Leverage verified, up-to-date data to identify high-risk lease expirations across your portfolio, optimize rent escalations, and manage tenant relationships, ensuring your portfolio stays healthy and profitable.
Strategic Portfolio Optimization
Use data-driven insights to pinpoint underperforming assets across your portfolio and maximize the value of your portfolio with confidence.
Informed Strategic Decisions
Make informed decisions on capital allocation, acquisitions, and dispositions by using portfolio-wide metrics to guide where to invest or divest, optimizing your portfolio for maximum returns.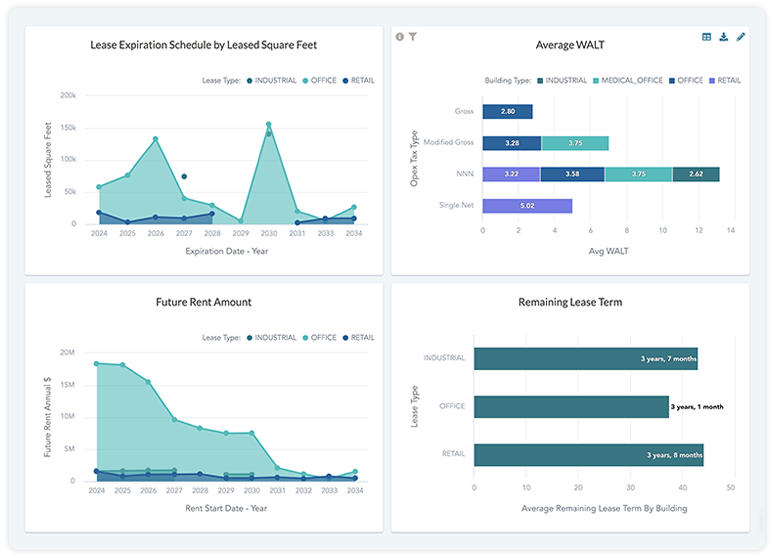
-
Optimize Performance & Mitigate Risk
Assess Asset Quality
Instantly gain visibility into portfolio-wide metrics like occupancy rates, lease expirations, and rent growth, quickly identifying underperforming assets and potential risks to portfolio health.
Identify Value Creation Opportunities
Dive into granular property-level data to uncover actionable opportunities across your portfolio, such as raising below-market rents or reducing operating expenses.
Assess and Mitigate Risk
Spot portfolio-wide risks like upcoming lease expirations, financial exposure to underperforming assets, or high tenant turnover, and take proactive action to mitigate them before they impact performance.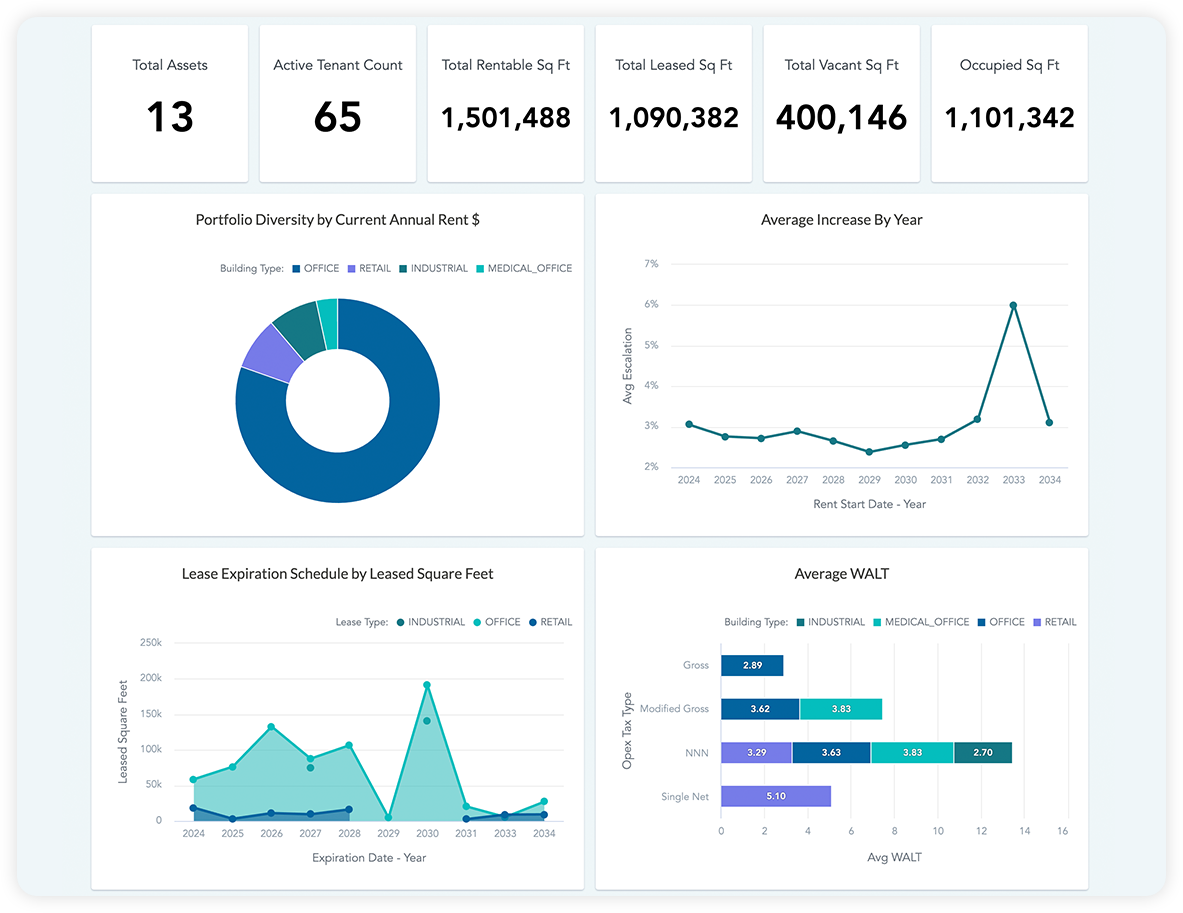


Real-Time Portfolio Reports
Your portfolio is more than a collection of properties—it’s a living, breathing entity. Our reports help you understand it at every level.
-
Leasing
Track tenant distribution, lease terms, and financials like security deposits and CAM charges.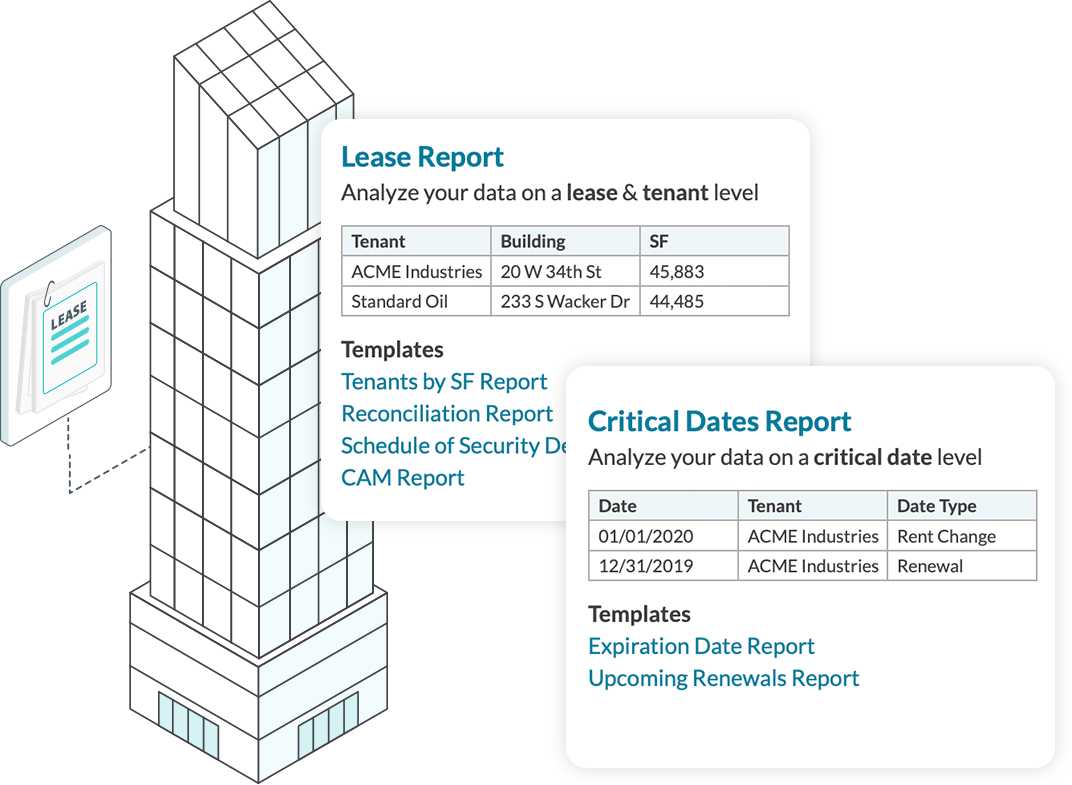
-
Critical Dates Reports
Monitor lease expirations and renewals to avoid surprises and plan ahead.
-
Building Reports
Analyze individual asset performance to identify thriving properties and those needing attention.
-
Deals Report
Consolidate all deal activity across your portfolio for a unified view of transactions and performance.
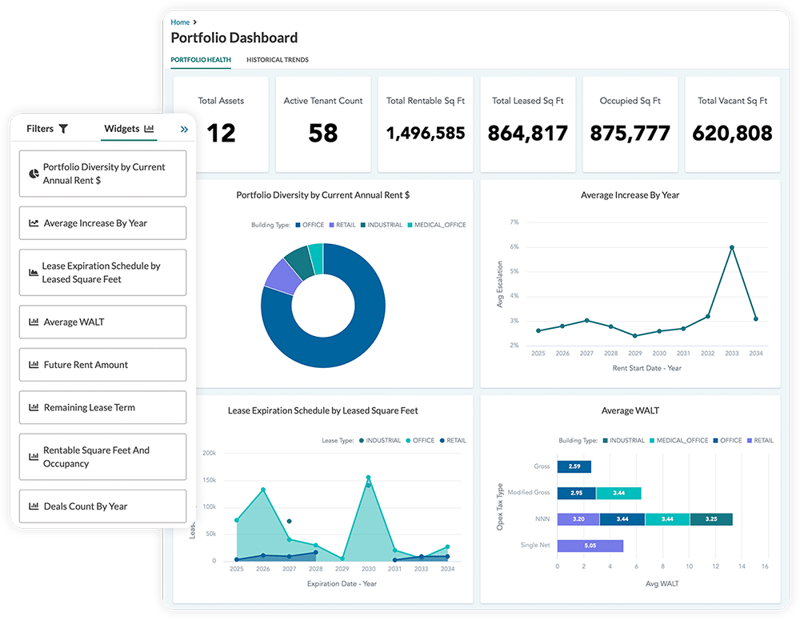
Interactive Portfolio Dashboards
Visualizations bring your data to life.
-
Porfolio Diversity by Rent $
Visualize revenue distribution across asset types and geographies.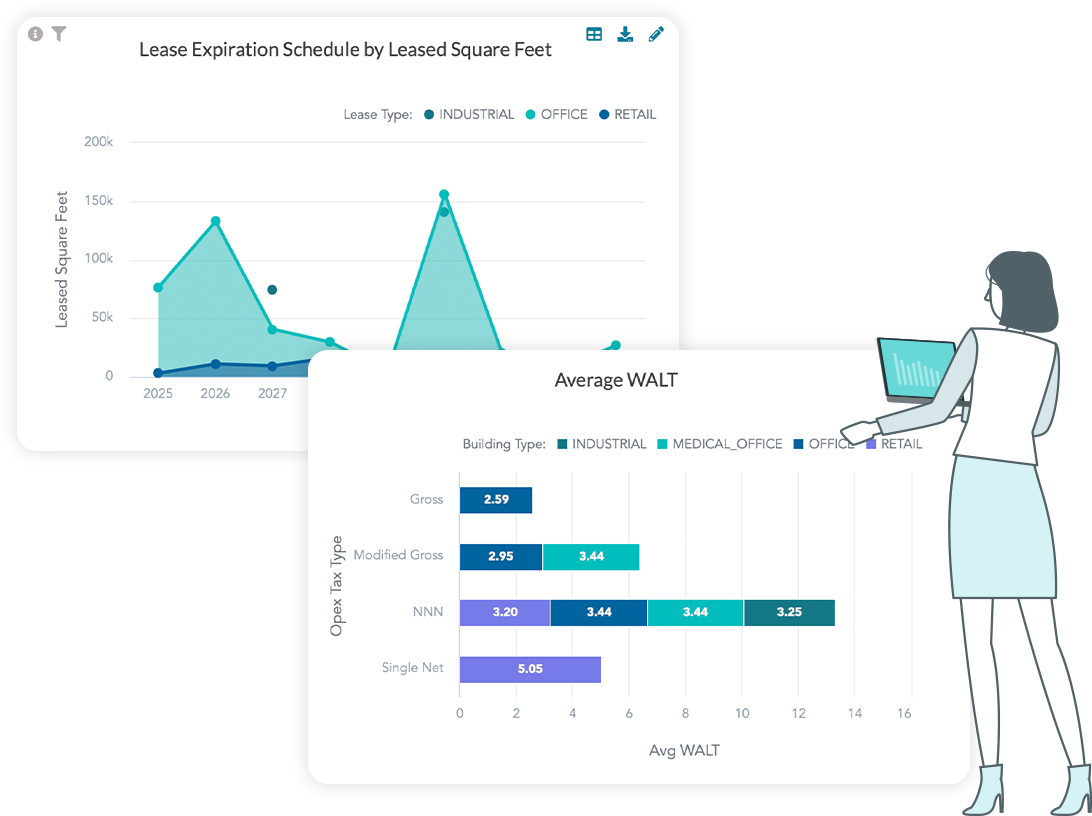
-
Lease Expiration Schedule
Strategize for the future with a clear view of upcoming lease expirations.
-
Average WALT by Asset Type
Assess lease term stability and identify potential risks.
-
Rental SF & Occupancy
Measure space utilization and optimize occupancy rates.
Illustrative Historical Trends
Learn from the past, plan for the future.
-
Historical Deal Activity
Review past deal performance to refine your investment strategy and capitalize on emerging opportunities.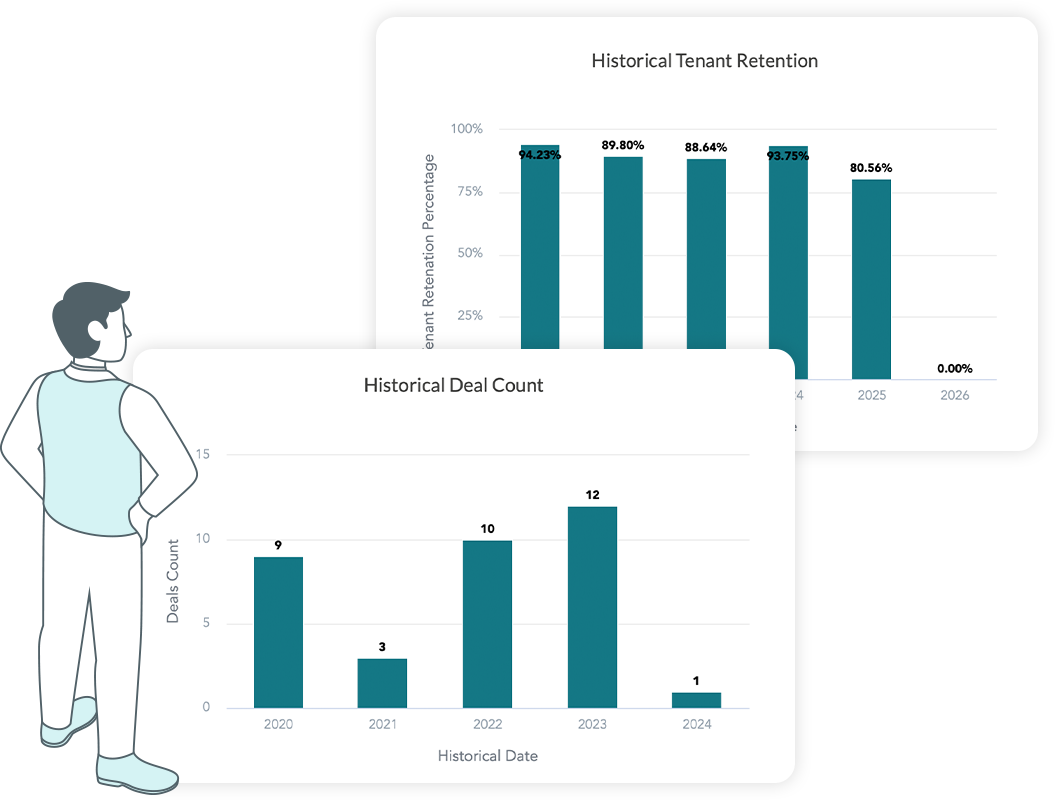
-
Historical Tenant Retention
Analyze tenant loyalty trends to strengthen retention strategies and reduce turnover.
-
Historical Rent Growth
Benchmark past rent increases to forecast future revenue potential and set realistic targets.
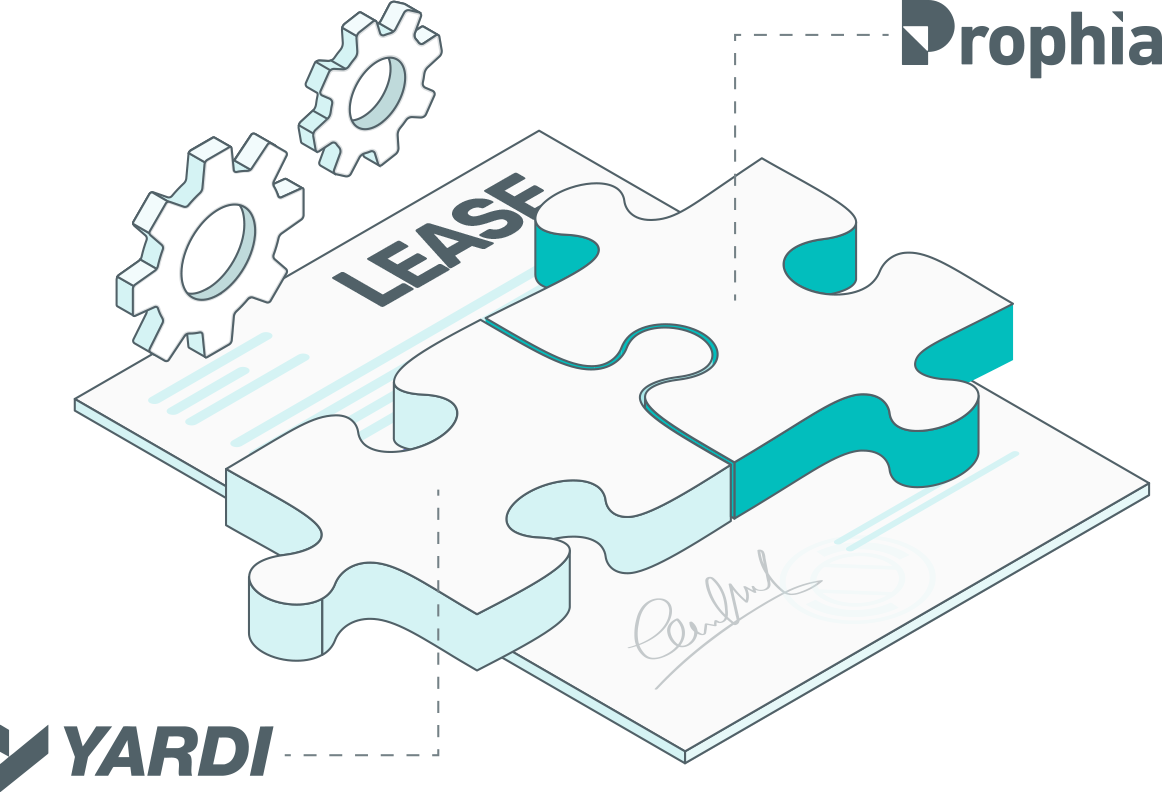
Complete System Integration
Prophia’s Automated Yardi Audit
Prophia’s Yardi audit feature automatically checks for discrepancies between lease data in Prophia and your Yardi accounting system. Stay informed and in control with periodic audit checks that notify you of any inconsistencies, allowing you to address them promptly.
Learn More